Lighthouse Reports
The Lighthouse report extension for Google Chrome scans the web page that your browser is currently on and compiled a report detailing a score out of 100 regarding the following aspects of the page:
- Performance
- Progressive Web Application
- Accessibility
- Best Practices
- SEO
The report is then split up amongst these categories and informs you on metrics regarding performance, opportunities to take on which can optimise load times and feedback on audits conducted; whether they have passed, failed or some that aren't applicable.
In order to make use of this extension, you will require a new Google chrome profile specifically for this. This is due to the fact that other extensions installed on an already existing profile can interfere with the report.
Creating a fresh chrome profile
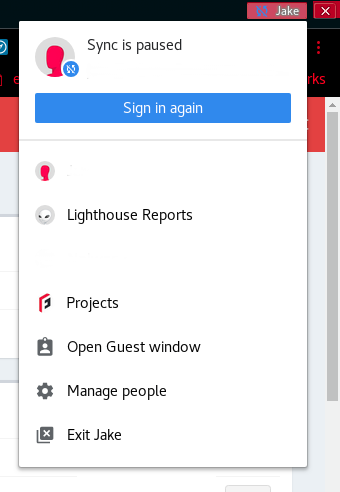
Firstly, click on the profile button in the top right hand side of your chrome window. This will display a menu containing your current profiles, as well as a "Manage People" option. Click on that option.
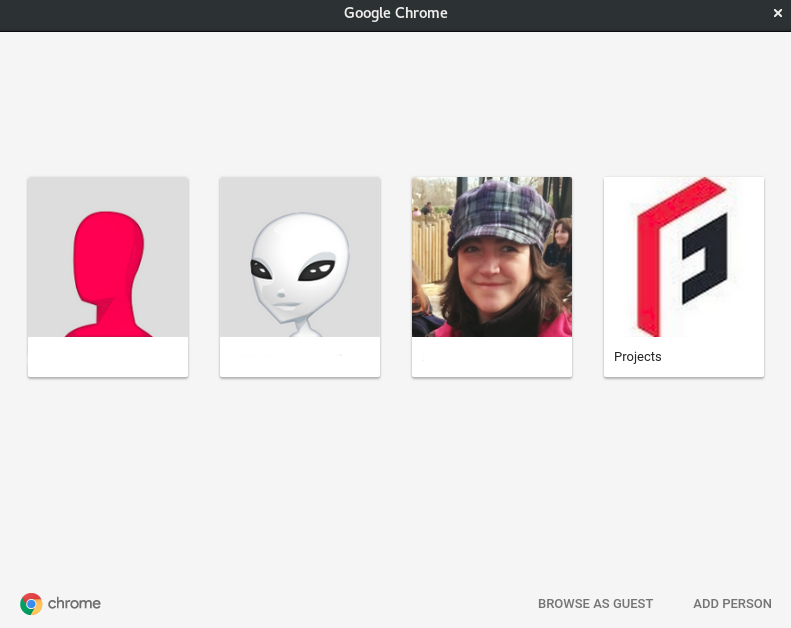
You'll then be presented with a window with your already existing profiles. Click on the "Add Person" button at the bottom of the window.
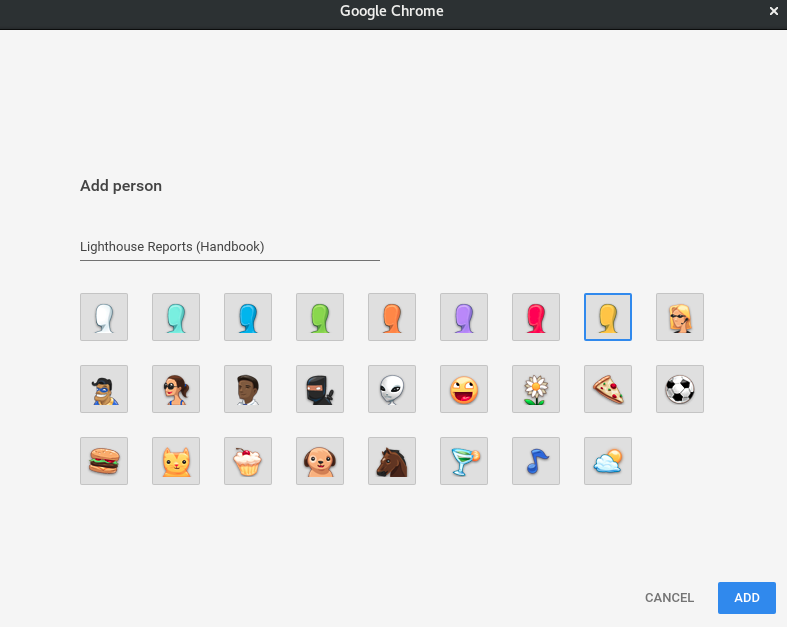
Enter a name for the profile, select an icon for it and the hit "Add".
Installing the Lighthouse Report Extension
In your new profile, head over to this link and click on "Add to Chrome" to install the extension.
Using the Lighthouse Report Extension
Once that's installed, head over to the website you'd like to run it on, click on the extension icon in the top right, and click on "Generate Report". For this handbook pagepage, I've decided to run it on Google's homepage. For a more accurate report, make sure that throttling is un-ticked.
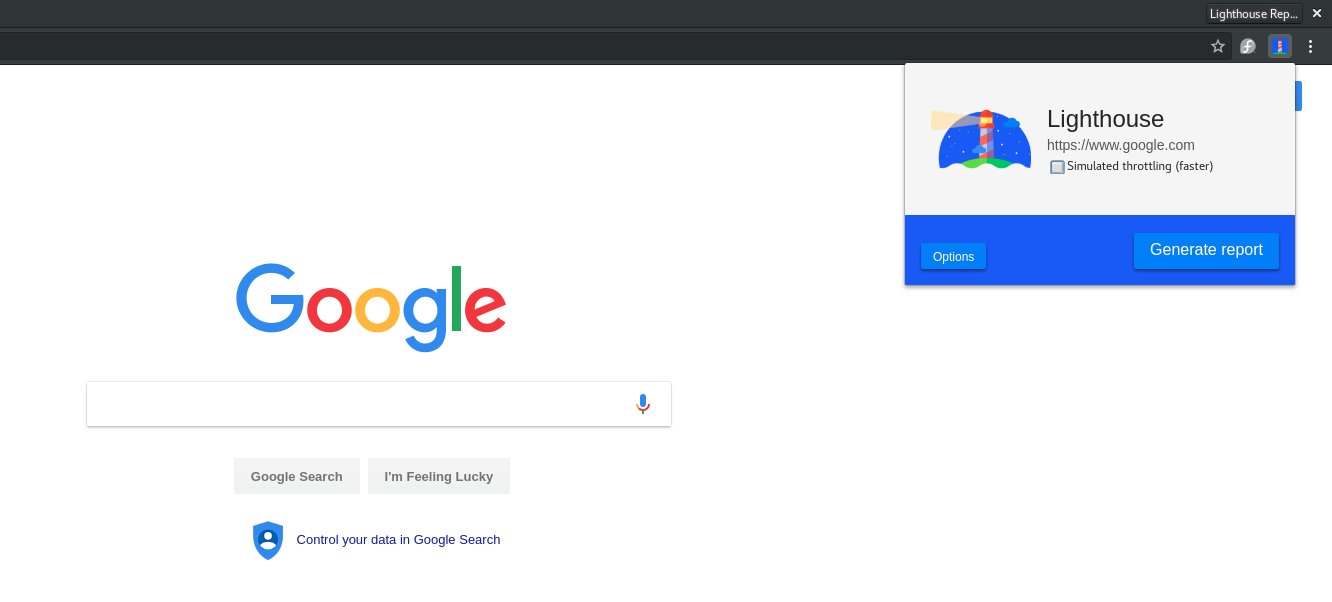
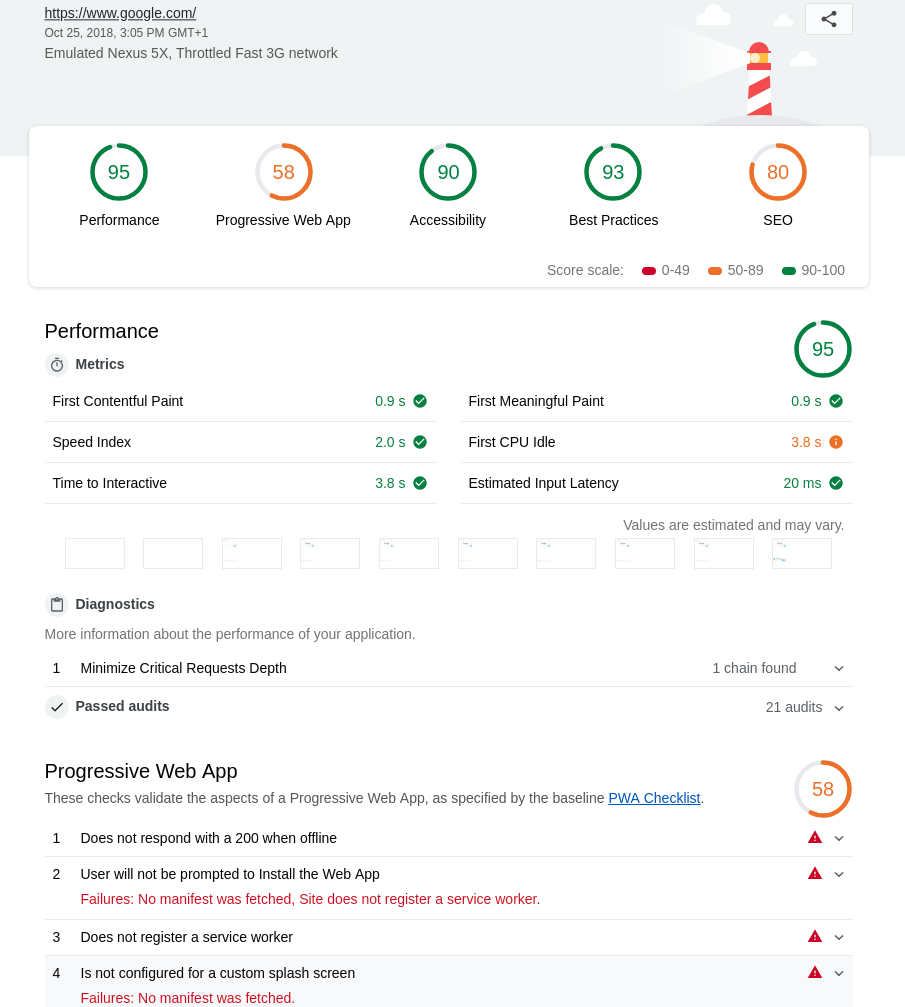
It will then begin the scan. The browser window that you currently have open will change whilst this is taking place. When it's done, a new window will appear, displayihng the report from the page you ran it on.
This report will detail all the aspects mentioned at the begining of the page, with further information in the expanded sections. To visit a specific aspect of the report, simply click on the score relating to that aspect.
Saving the Report
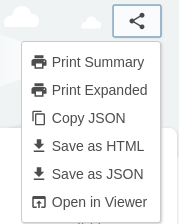
Clicking on the "Share" icon at the top of the report will give you a few options in regards to saving the report. You can print (or save as PDF in print set up) the report without the expanded details under "Print Summary" or with the expanded details under "Print Expanded" or save as a HTML file under "Save as HTML".
Sharing Reports with clients
We like to do these reports for new potential clients as a way to show them how we can be of use to them. When you've ran the reports you need for them, save them as "PDF Expanded" and "HTML". We can then take these files and send them over via email as an attachement.
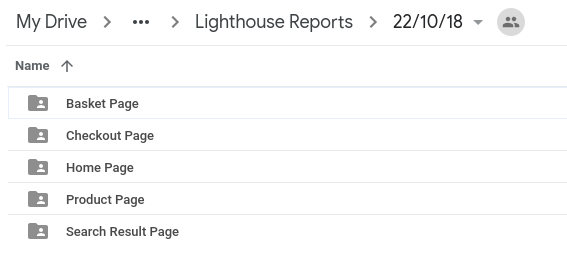
If we're sending them over to a current client, then these can be copied to their shared folder in our G Drive. To make it easier to sort through, create a folder hierarchy for each page that we test (Basket, checkout, home, product and search result pages).
Once they're saved on there, send them an email or a message on Slack informing them that the new reports are ready to review.
Tracking Scores and Progress
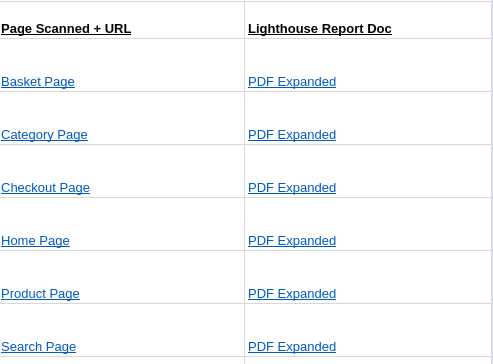
We use a spreadsheet system to get a summary of the overall scores for the pages we scan, as well as a system that identifies positive and negative changes if the reports are done weekly.
As you can see, we do this for all of the pages we run the report on (Basket, checkout, home, product and search result pages). To help keep these reports together, we link the ones that are saved on the drive in the spreadsheet.