Creating A Custom Jira Dashboard
After setting up a new Jira for a client, one of the features we need to sort out is the custom dashboard on the homepage of their Jira.
We set this up in such a way that we're able to see the total number of issues and who they're assigned to in their Magento project, as well as a feed containing all action happening on the Jira, such as new tickets being created, updates regarding the status of tickets and any comments or attachments that are made in relation to them.
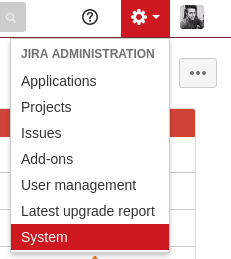
To begin with, log in to the Jira you want to set this up on, click on the cog on the right hand side of the screen and then click on "System".
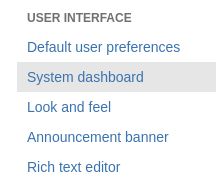
Once you're on the system page, scroll down the page a bit and click on "System Dashboard" on the right hand side of the screen under the "User Interface" section.
This will give you a snapshot of what the Jira dashboard looks like at the moment.
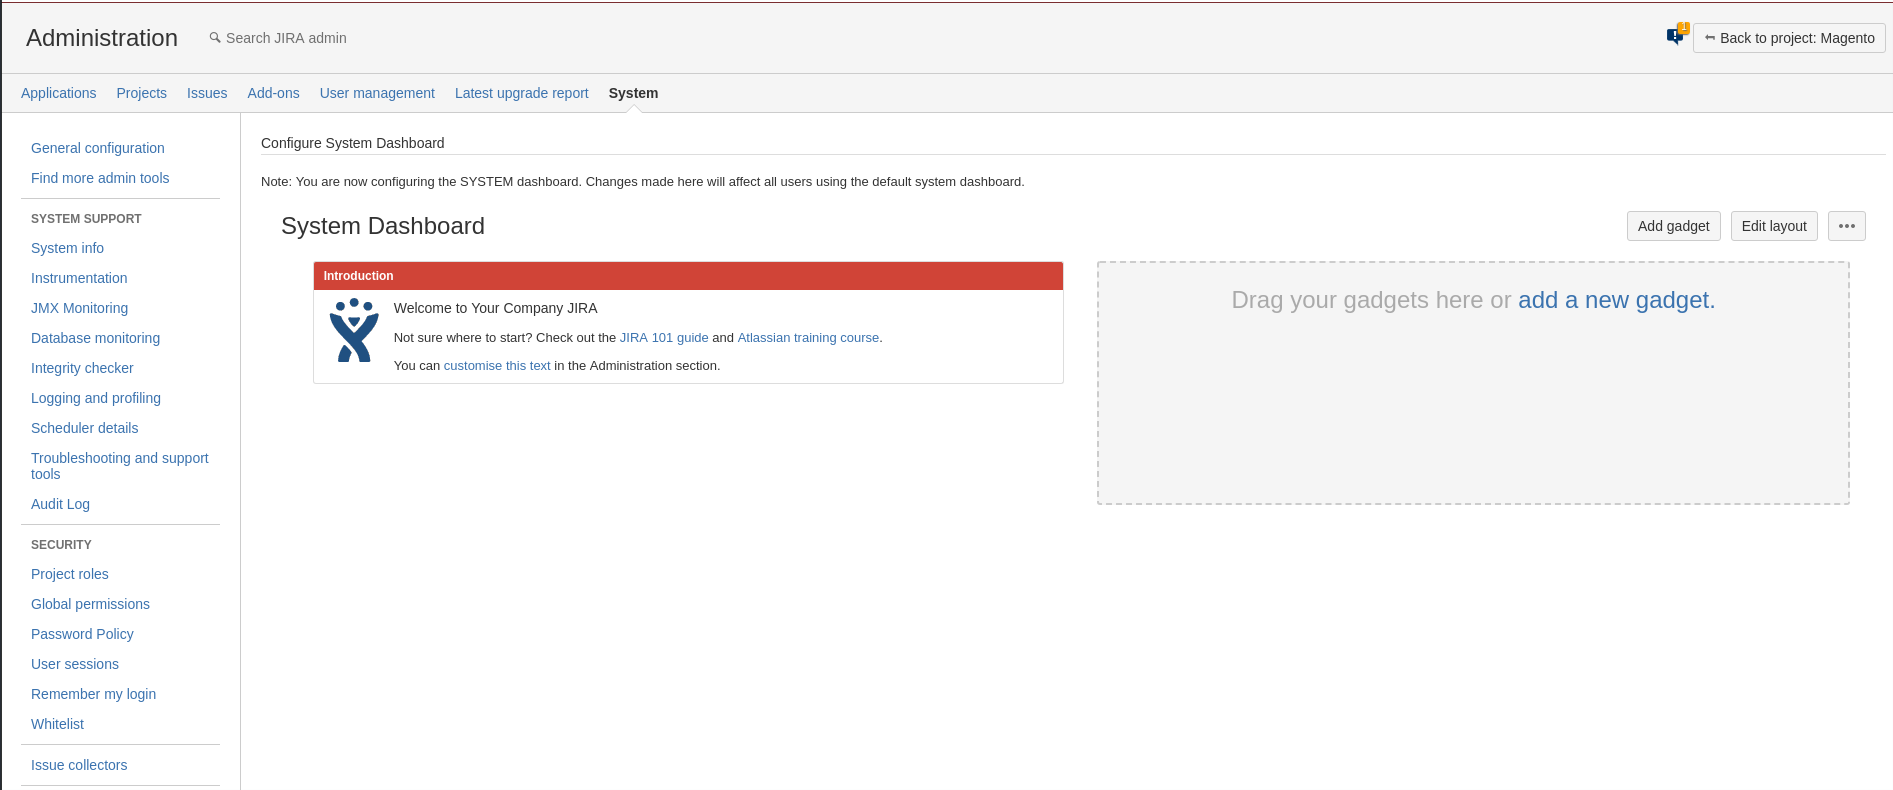
To start adding these features we mentioned earlier, or "Gadgets", click on the "Add Gadget" button in the upper right corner.
A pop-up will appear, giving you a couple of gadgets to add to the dashboard. To view the full collection of gadgets, click on the blue link labelled "Load all gadgets".
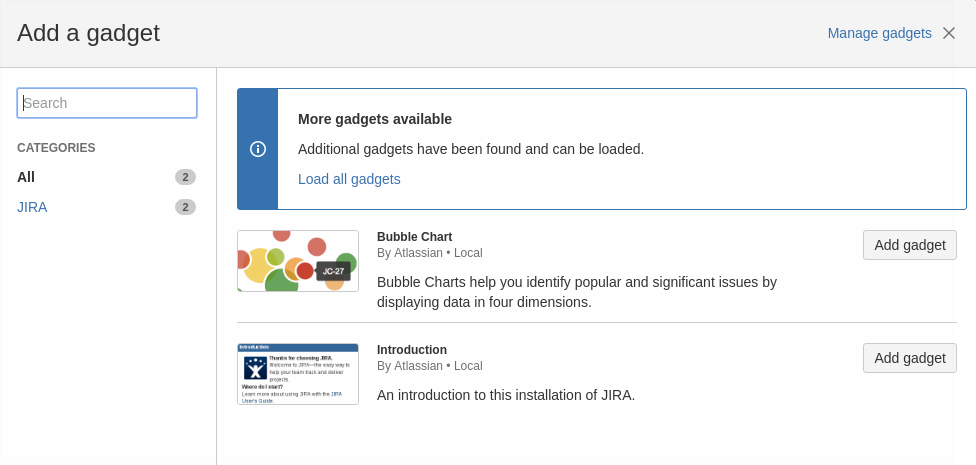
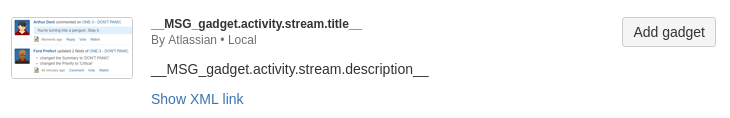
The gadgets window will then expand and show you a larger collection to choose form. The first one we're going to add is the"_MS_gadget.activity.stream.title_" gadget, or the "Activity Stream" that you can see below. Click on "Add Gadget" to place it on the Dashboard, and then close the window by pressing the "X" in the top right hand side of the screen.
These client Jira's follow a uniformed layout so that we can adhere to consistency. The activity needs to be on the left hand side of the screen on the dashboard. If it isn't already placed in that position automatically, then simply click and it over using the "Move" icon shown below.
![]()
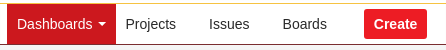
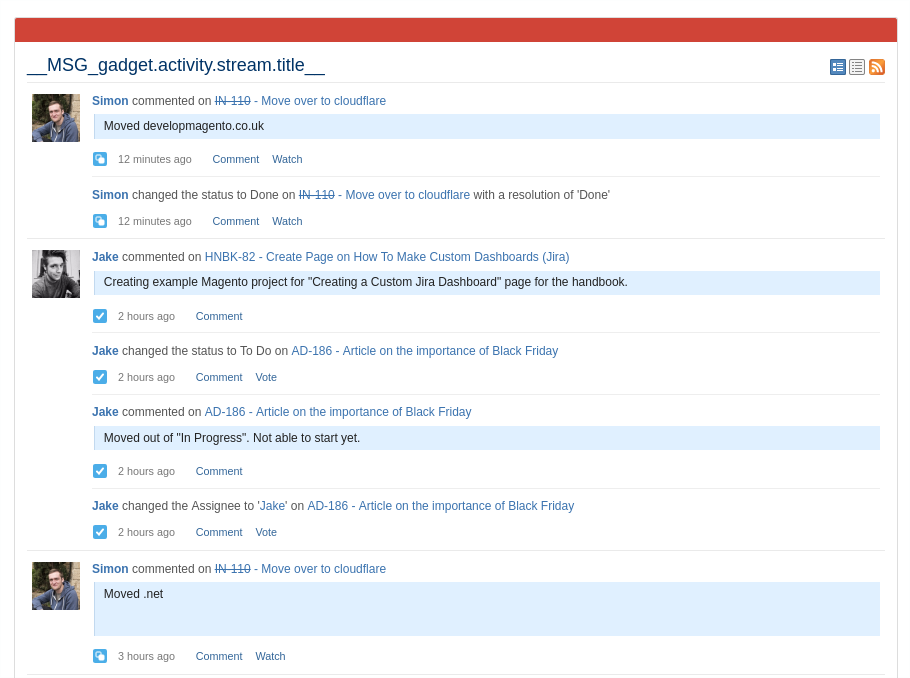
Upon adding it, the gadget will continue to try and load whilst we're still configuring the dashboard. To check that this is working properly, middle click the "Dashboards" button in the top left of the page to see it on the main dashboard page. It will look like the following down below.
When you're satisfied, head back over to the tab where you were adding the gadgets, bring up the gadget window and load all of the gadgets again.
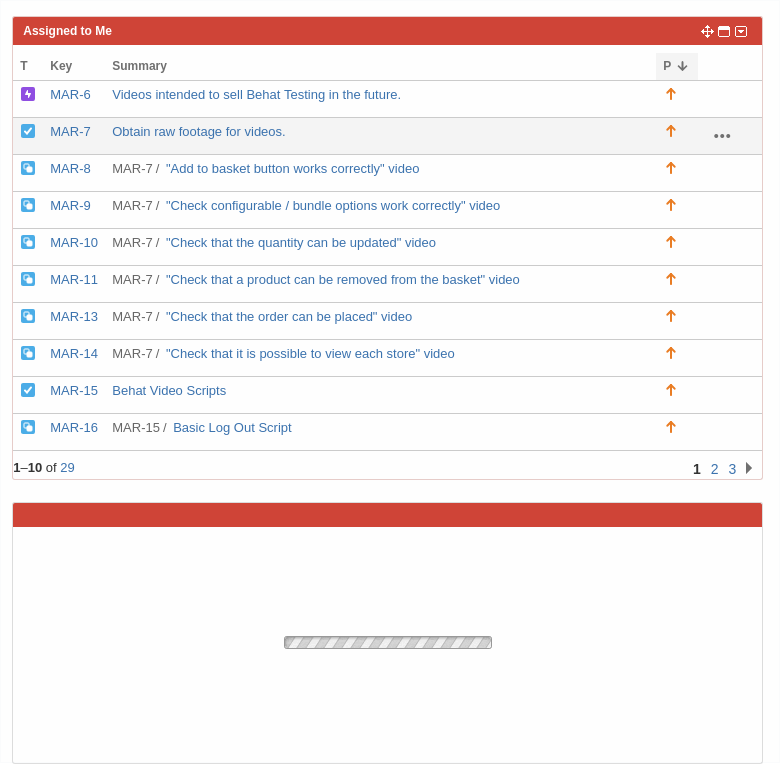
The next one we'll add is the "Assigned to me" gadget. This lists tickets that have been assigned to the user that you are logged in as.
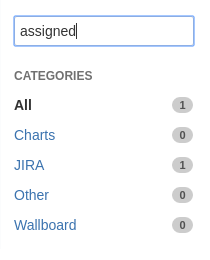
As well as scrolling down through the list of gadgets we have access to, we're also able to search for those that we know the name of. Type in a keyword in the gadgets name to begin filtering them out. Once you see which one you want to add, in this case, the "Assign to me" gadget, click on "Add gadget" to place it on the dashboard.
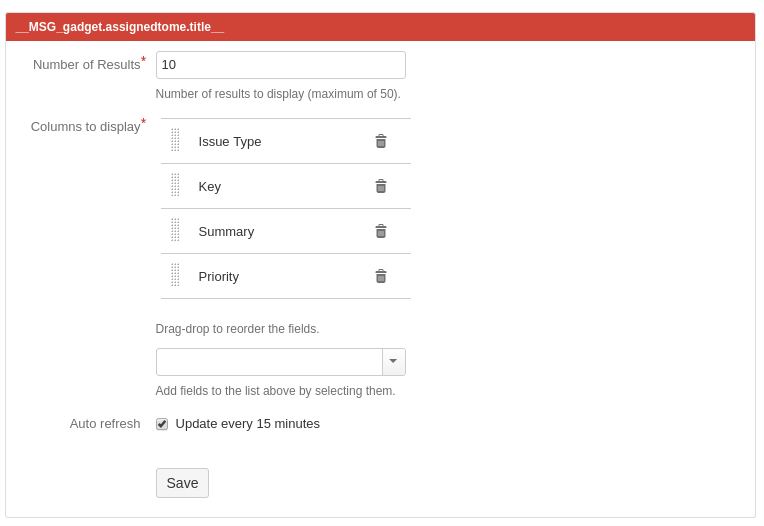
When it's been added, close the gadget window so that you can configure it. From here, you can select how many results you'd like the gadget to display, which information you'd like to display in the "Columns to display" section, add more fields and columns to display and also set an "Auto refresh" to occur every 15 minutes. We leave all of these settings as they are, but tick the "Auto refresh" box so that they are updated in real time. When you're happy to do so, click on "Save"
In regards to the layout, we're going to want to place this gadget above the "Activity Stream" so that whoever logs in can see a summary of their assigned tickets straight away. Again, move this over by using the "Move" icon.
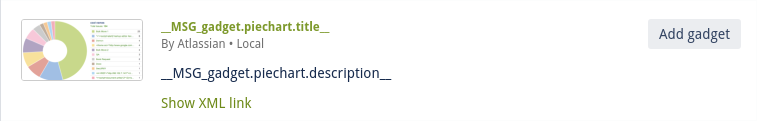
The final gadget we need to add to the dashboard is the "Pie Chart" gadget. This gadget presents statistics about issues in Jira in the form of a pie chart. Instead of adding the one version of the gadget, we're going to add 3 and configure them so that they display different information. We want one for each of the following filters:
- Issue status
- Assignee
- Issue Type
Once again, open up the gadget window, load all the gadgets like we've done before and type "Pie" in the search bar on the left hand side. When you see it appear, click on "Add gadget".
You'll then see the gadget being added to the dashboard. Close the gadget window so we can configure the first version of the gadget, the "Status" version.
In the config window, similar to the one we saw previously, type in the name of the project we want to filter issues through. In this case, it's the Magento project that should be set-up already.
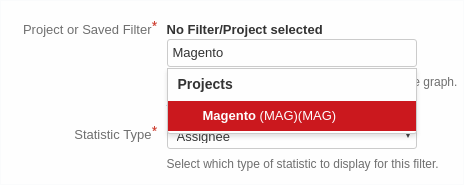
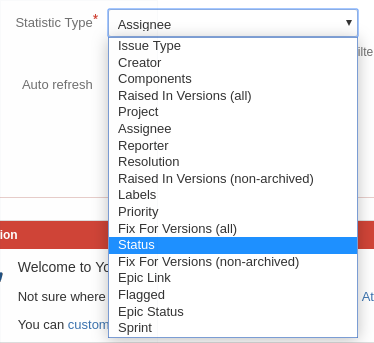
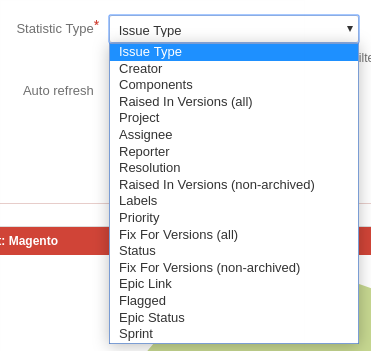
Then, where it says "Statistic Type", click on the drop down menu and select "Status".
Also, make sure that you have checked the "Auto Refresh" box again, so that it is updated in real time. When ready, click on "Save".
Note: If there are no tickets in the Magento project, create a test one to see if the pie chart works as intended.
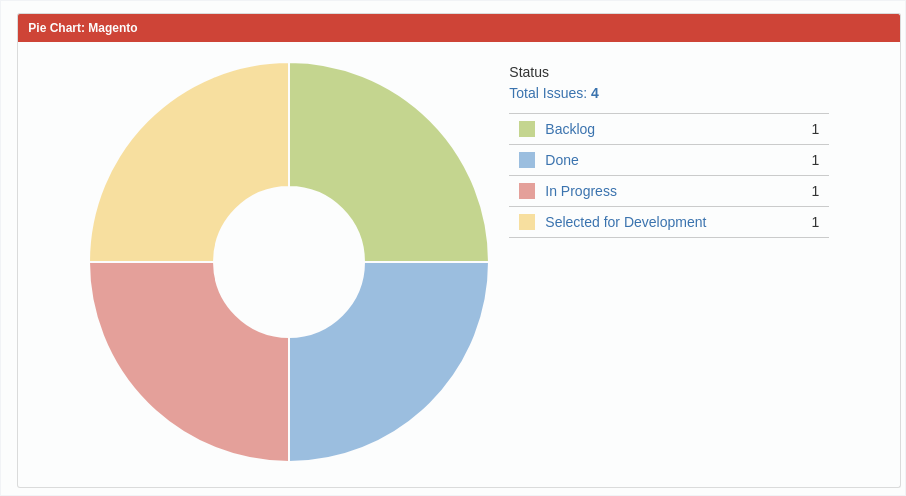
As you can see from the below image, the pie chart is now showing all the tickets in the Magento project and what their status is on the kanban board. I have created a few tickets under this project and moved them across the kanban board so that we can see what the different segments look like for each stage.
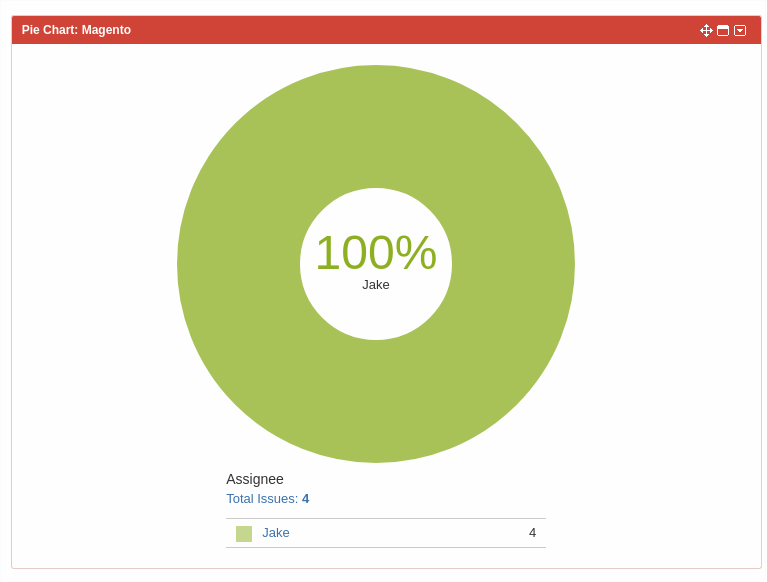
The next version of this pie chart we're going to make is the "Assignee" version.
Add the pie chart gadget to the dashboard using the same steps as before until you come to the part where we configure the gadget.
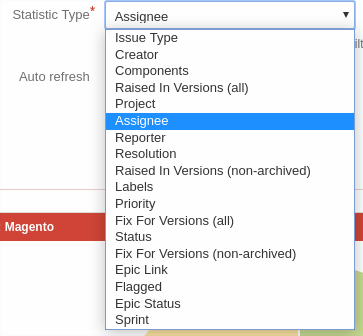
Make sure that the project is set to "Magento" again, check the "Auto refresh" box but this time, select "Assignee" form the "Statistic Type" drop-down menu.
Once again, click "Save" and the pie chart will appear on the dashboard, displaying all the tickets that are in the "Magento" project and who they are assigned to.
Different assignees will be displayed in different colours.
The final version of this gadget we'll be adding is the "Issue Type" pie chart. This one displays a total count of the different issue types that are saved under the "Magento" project.
Again, follow the previous steps to add the pie chart to the dashboard until you come to the configuration part.
Same as before; make sure you select the "Magento" project, tick the "Auto refresh" box but this time, choose "Issue Type" from the drop-down menu.
When ready, click on "Save" to add it to the dashboard. You will then see a summary of all the issue types within the "Magento" project.

Before we're finished configuring the dashboard, there's one thing we need to do, and that's to arrange these new gadgets according to the layout we follow.
We order the right hand side of the page as follows, using the "Move" icon:
- Introduction at the very top, followed by;
- Status
- Assignee
- Issue Type.
With those arranged, we've now finished putting together a custom dashboard for a client's Jira.